Can AI Actually Help With a Common Wi-Fi Complaint? A Look at LLMs for Support
Sifting Signals: commentary on using data to reason about Wi-Fi behavior and use cases at scale, whether you are designing features, tuning performance, or debugging issues.
Summary:
With all the attention surrounding AI over the past few years, an often repeated question in my discussions has been some version of: “What possibilities can be unlocked with AI for Wi-Fi networks?”
Wi-Fi chipset vendors are already building AI-driven features for optimizing performance for the Wi-Fi client. However, this article looks at the support side of the problem: how a general purpose large language model (LLM) could help with Wi-Fi support, using a common and relatable poor Wi-Fi coverage complaint as an example. I hope you find value in this insight.
Using a basic setup, the article:
- describes the user complaint
- explains the physical setup and the telemetry data collected for this scenario
- provides a high-level view of the system
- describes the AI assistant setup
- scrutinizes the AI assistant’s response when given the field data, and
- qualitatively analyzes the AI assistant’s strengths and weaknesses
The example doesn’t span the entire real problem space, but it is simple enough to understand in detail and real enough to extract meaningful lessons. The main takeaway is that, in this simple setup, an off-the-shelf LLM can extract some broad patterns from the data but without the right data or guardrails it can speculate about causes, which can mislead end users. Real field issues and production systems are more complex, and any takeaways here need careful system design before they are applied more broadly.
1. Problem
To make this tangible, I picked a familiar complaint: Connection ‘feels’ very fast in the living room where the router is located but in the office room, the video calls and browsing ‘feel’ slow. This article focuses on this one simple incident and asks: can a simple AI assistant help with it, and if so, to what extent?
2. Setup & data collection
Setup
The setup is simple: a retail dual-band (2.4 GHz /5 GHz) Wi-Fi 5 router and a MacBook client used at two locations:
- Location 1 - in the living room, close to the router
- Location 2 - in the office, farther from the router
At each location, the client is stationary while measurements are collected.
Data logging
A small data-logging script runs on the MacBook and records data once per second:
Wi-Fi link metrics:
- RSSI,
- Noise
- SNR (computed)
- Uplink Tx PHY rate
- Channel
Latency metrics:
- Ping round-trip time (RTT) to the gateway (LAN)
- Ping RTT to the internet (WAN)
These are all client-side measurements. There is no access to AP side data.
AI assistant used
For the AI assistant, I use an off-the-shelf, pre-trained LLM (gpt-4.1-mini). These models are typically trained on a mixture of publicly available data from the web, licensed data and data created by human trainers.
3. High-level system view
The diagram below shows a high level view of the system used in this article.
- The blue blocks are the common pieces: the Wi-Fi network, a data logger on the client, and a simple telemetry database (a CSV file in this case).
- The green block represents a typical current pattern in organizations, where a Wi-Fi engineer analyzes the field situation using logged data.
- The orange blocks represent an AI assistant (pre-trained LLM) that looks at the same data and produces its own summary.
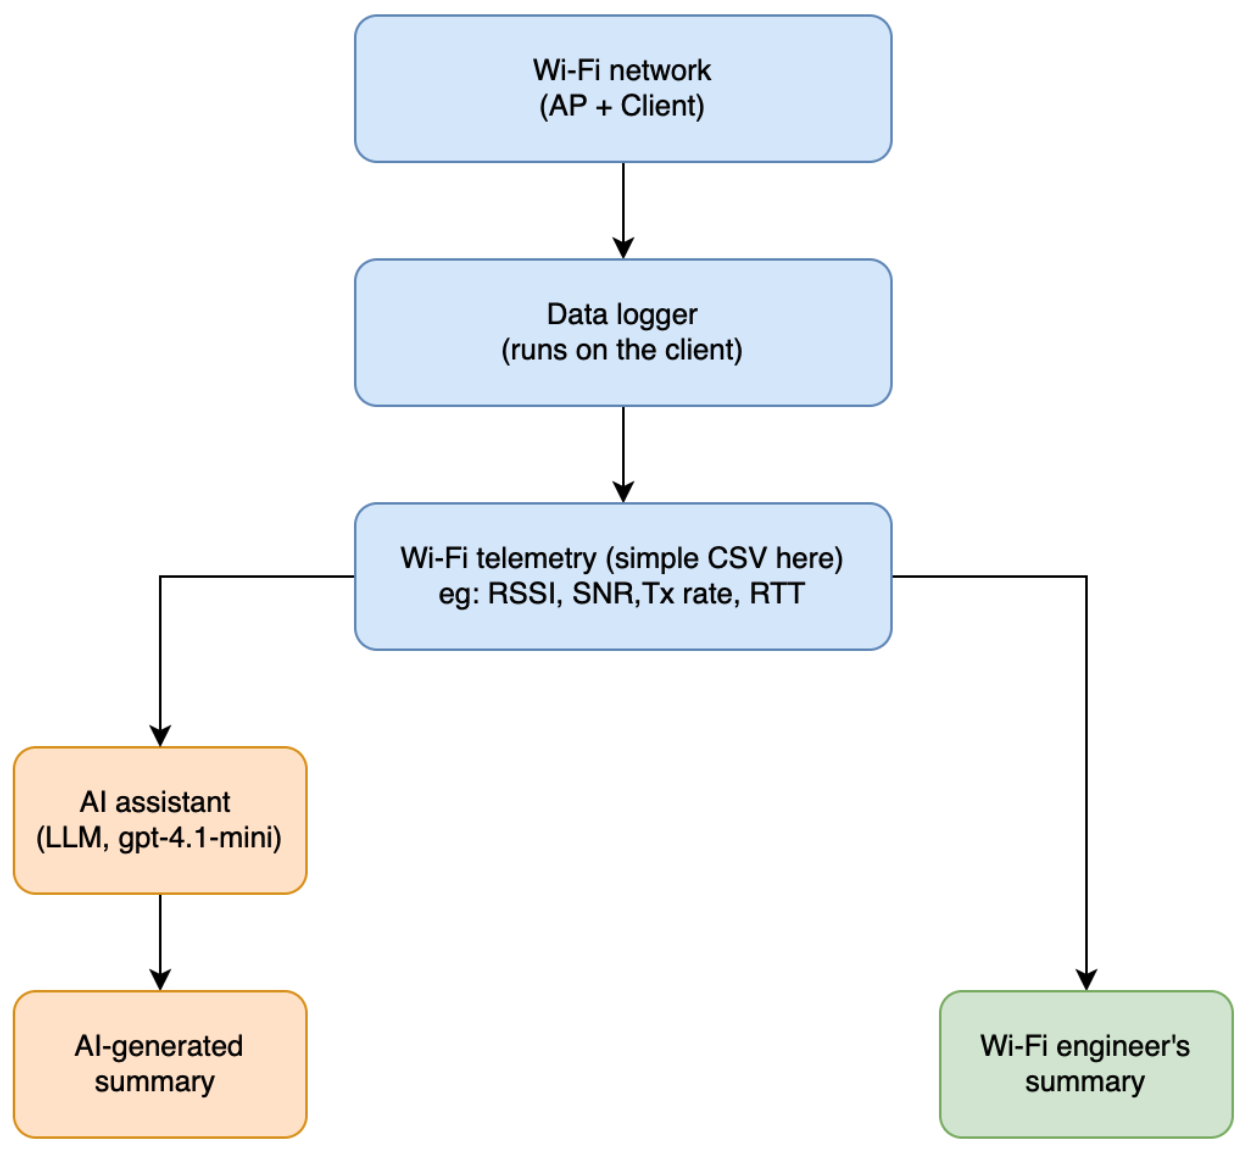
In a production system, a Wi-Fi engineer would usually have access to telemetry from multiple sources captured at different layers (RF, PHY, MAC, network, application), along with firmware and cloud logs when needed.
4. AI assistant setup: a very basic helper
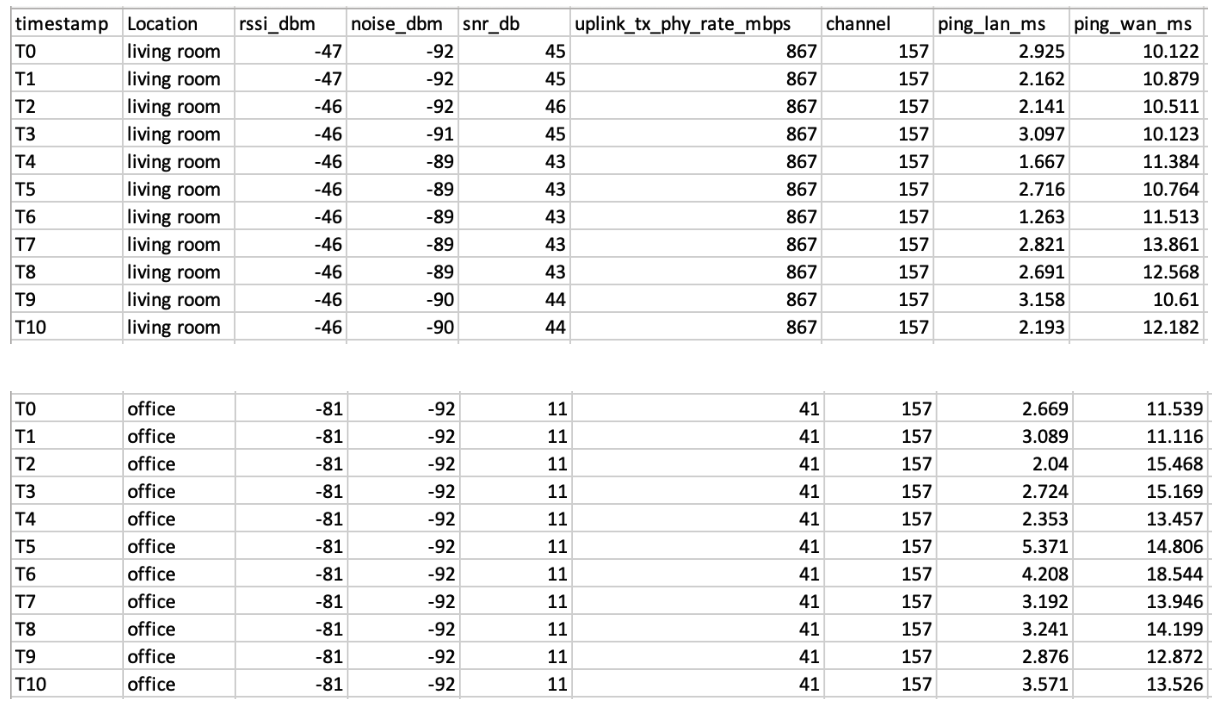
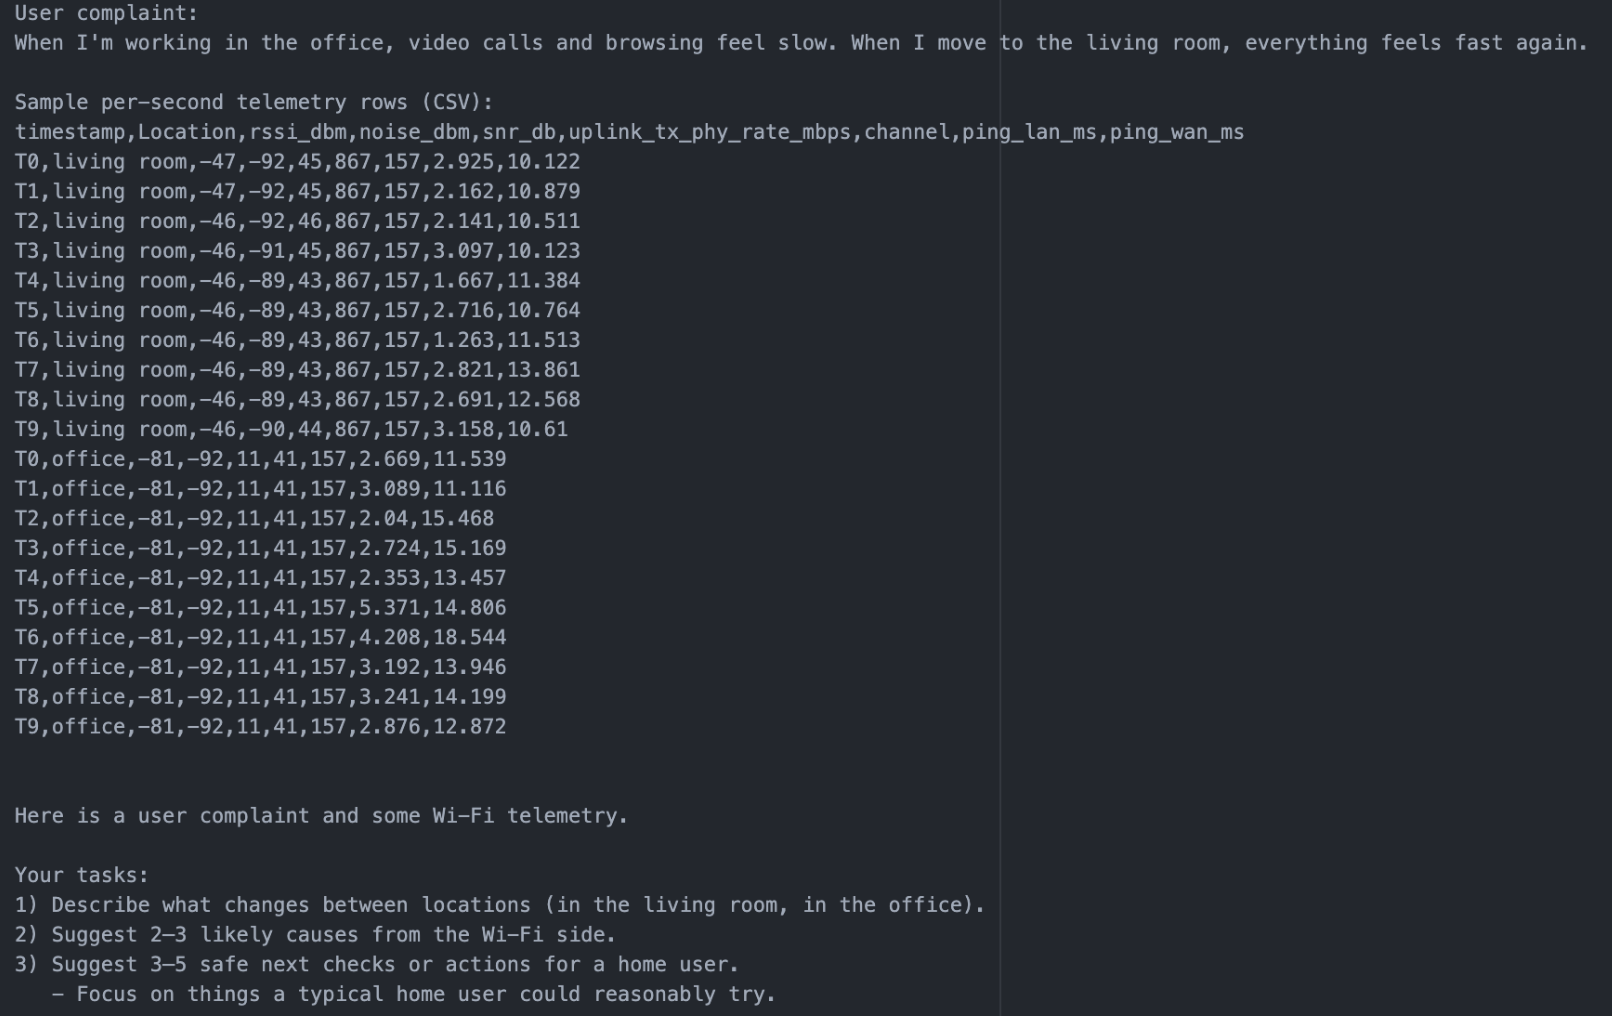
For this experiment, the AI assistant receives:
- the user complaint text
- a time series table of metrics (RSSI, Noise, SNR, uplink Tx PHY rate, channel, LAN/WAN latency) tagged with the location (living room, office), captured from the client only (snapshot below)
- a simple prompt:
“Here is a user complaint and some Wi-Fi telemetry.
Your tasks:
1) Describe what changes between locations (in the living room, in the office).
2) Suggest 2–3 likely causes from the Wi-Fi side.
3) Suggest 3–5 safe next checks or actions for a home user.
- Focus on things a typical home user could reasonably try.
Be explicit and concise.”
5. AI assistant’s response: a closer look
Here’s a snapshot of the summary generated by the LLM:
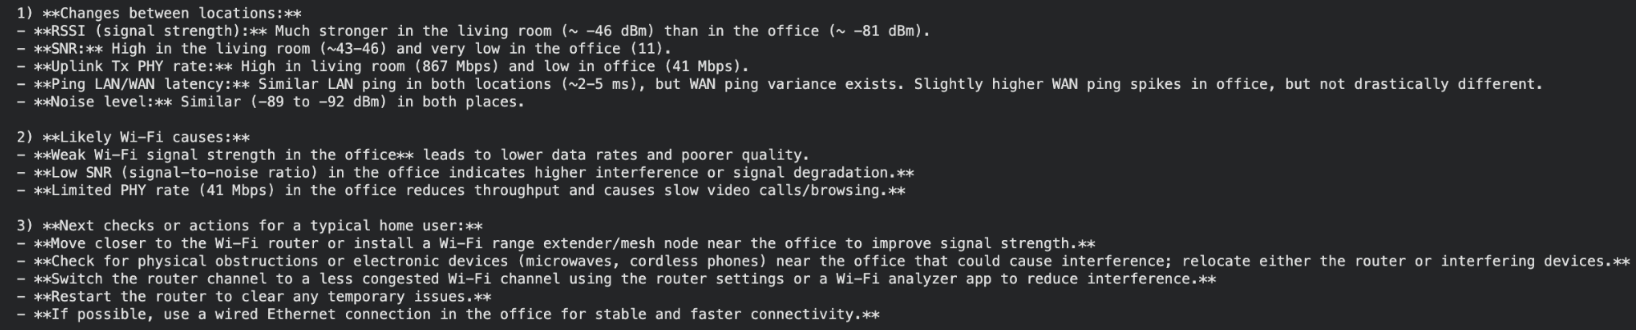
Scrutinizing the ‘observed changes’ and ‘likely causes’:
From this snapshot, the assistant correctly identifies that the RSSI (~ -46 dBm vs ~ -81 dBm), SNR (~ 43-46 dB vs 11 dB) and uplink Tx PHY rate (867 Mbps vs 41 Mbps) are much better in the living room than in the office. It’s good to see that it treats latencies of ~2-5 ms and noise levels of -89 to -92 dBm as those being more similar than different.
It also does a reasonable job of linking the drop in RSSI/SNR in the office to a deterioration in link quality. Interestingly, it also brings up “throughput” even though it was given Tx PHY rate rather than actual throughput measurements.
However, it also adds generic “interference” as a possible cause without any supporting evidence in the data or a clear way to test the hypothesis.
Zooming into the ‘next checks’:
Some of the suggested next steps can serve as reasonable first checks, such as:
-
moving the device closer to the router to see if the signal strength improves,
-
reducing obstacles between router and office and
-
restarting the router as an easy option for the user to try
But others such as ‘minimize interference’ are too generic and not grounded in facts to show to the end user. Also, advice such as “install a mesh/Wi-Fi range extender” without any context about whether the current Wi-Fi system supports it, or whether an engineer would need to recommend and provision new extender hardware is not realistic. Suggesting the user to use a wired Ethernet connection in the office without understanding the physical limitations such as accessibility can be confusing.
6. Analysis: strengths and weaknesses
In this simple setup, the very basic AI assistant is still useful to:
- notice general trends (for example, “signal strength in the office is worse than in the living room”)
- suggest a few reasonable, simple next steps
However, it clearly falls short in other ways:
- It doesn’t clearly distinguish between different root causes (coverage vs interference).
- It provides generic advice that also seems impractical as one of the first lines of action, such as addition of an extender, without considering user or system constraints.
- It shows no awareness of missing data that would help disambiguate between different causes (for example, use of channel utilization or retry rates to infer interference).
So, the basic assistant is directionally helpful but not sufficient on its own. For this specific example, a simple heuristic such as nudging the user to move close to the router when the RSSI is very low would be already good enough. Using a LLM helps illustrate the model’s behavior in a simple setting when it is presented with real telemetry data. In future articles, we will explore different ways to make these kinds of systems more useful.
7. Conclusion
Conceptually, a high level view of this workflow could look like the image below. Real deployments would include the data infrastructure and orchestration around it.
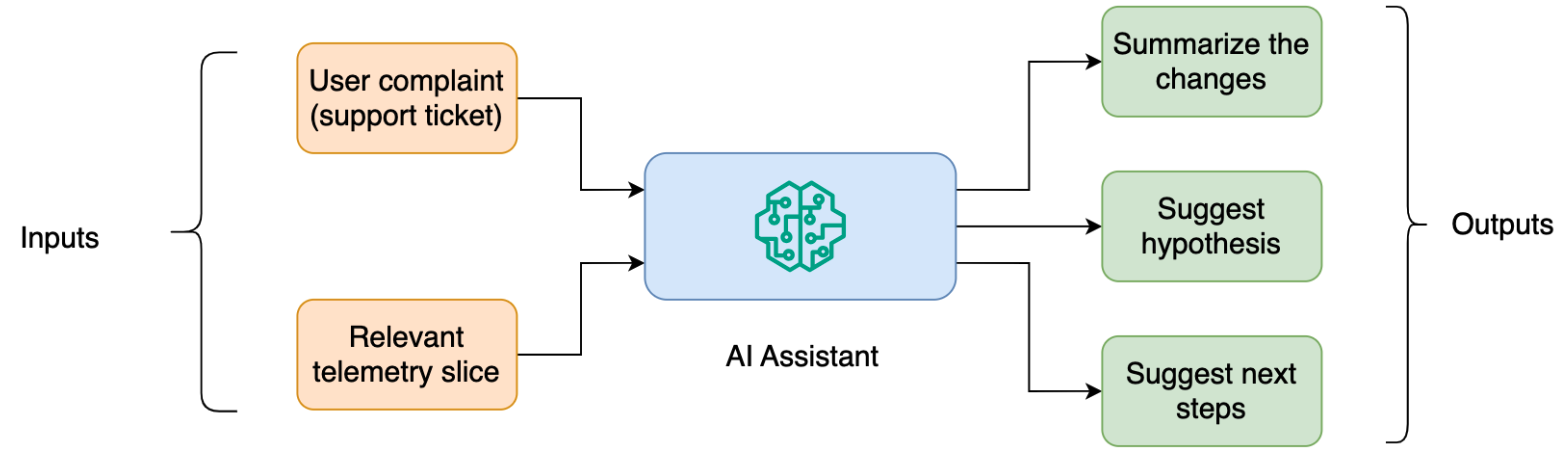
Even for this simple incident, a production workflow would need more structure around the assistant’s outputs. Some suggestions are actionable for the end user (for example, moving the device), while others are more technical and require due diligence before recommending to the end user (for example, adding an extender).
Overall, this justifies exploring LLM capabilities to augment the current support workflow, especially for capturing patterns in telemetry and turning them into structured hypotheses. If you are thinking about how to choose the right Wi-Fi telemetry, how to judge whether LLM responses are strong enough, or how to bring AI into your managed connectivity system for Wi-Fi use cases, feel free to reach out.
8. Appendix
Data collection details
- Client device: MacBook (macOS 12.7.4)
- Access point: retail dual-band Wi-Fi 5 router (2.4 GHz/5 GHz)
- Sampling interval: 1 sample per second
Capture durations:
- Living room: 2 minutes
- Office: 2 minutes
Wi-Fi metrics (RSSI, noise, Tx PHY rate)
- On macOS, the airport utility was used to collect Wi-Fi metrics
/System/Library/PrivateFrameworks/Apple80211.framework/Versions/Current/Resources/airport -I
Round-trip time
- LAN round-trip time (gateway ping)
ping -c 1 -W 1000 <gateway_ip> - WAN round-trip time (internet ping)
ping -c 1 -W 1000 <wan_host>
Sequence of actions
Every second, a script executed the following sequence of actions:
- ran the following command:
airport -I - ran one LAN ping and one WAN ping, and
- parsed the outputs (RSSI, noise, Tx PHY rate, LAN RTT, WAN RTT), computed the SNR and logged along with a timestamp, and location tag (living room, office) into a CSV file.
Recording LLM response
- LLM response was obtained using the following API from OpenAI:
response = client.responses.create(
    model="gpt-4.1-mini",
    input=[
        {
            "role": "user",
            "content": input_prompt,
        }
    ],
)

answer = response.output[0].content[0].text