Why Wi-Fi metric definitions matter
Sifting Signals: commentary on using data to reason about Wi-Fi behavior and use cases at scale, whether you are designing features, tuning performance, or debugging issues.
Overview
Earlier articles in this series, Part 1 and Part 2, examined how an AI assistant responded to Wi-Fi support telemetry and how additional telemetry could improve that response. This article shifts the focus one step earlier to the Wi-Fi telemetry itself. Using Received Signal Strength Indicator (RSSI) as an example, it shows how the value of a Wi-Fi metric can differ based on how it is measured even when it carries the same name.
1. Telemetry’s downstream uses
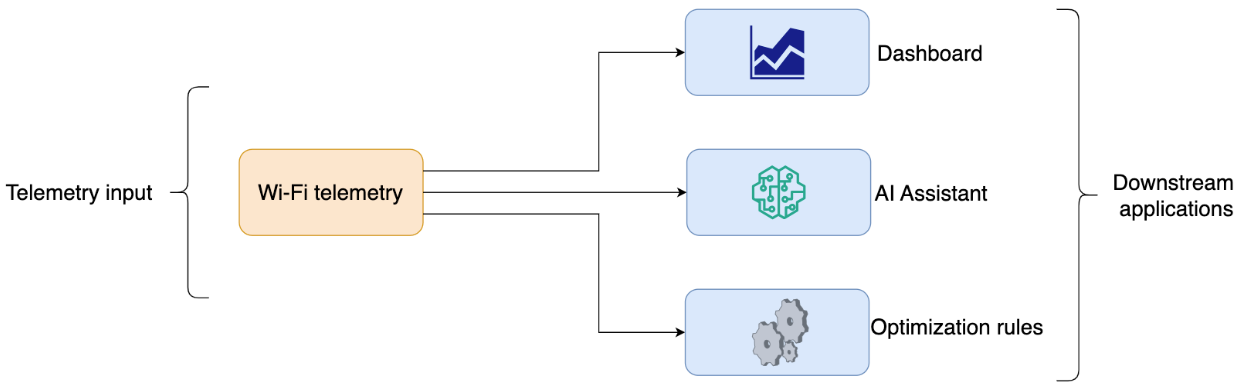
Wi-Fi telemetry can feed several downstream applications. A dashboard can use it to provide quick network insights, a network optimization rule can use it to trigger an action or an AI assistant can use it to explain what is happening in the network. A downstream application typically sees only the provided metric value, not how it was measured. Therefore, it is important to understand what the telemetry value represents before it is used downstream.
2. Why measurement method matters
Managed Wi-Fi systems often work with summaries such as averages or percentiles rather than raw samples. This is one practical reason why measurement method matters. Summaries help reduce storage requirements while still retaining useful information for downstream applications. If the values used to compute the aggregate are not measured in the same way, then the aggregate value can shift even though the metric name stays the same. Let’s look at it with RSSI as an example.
A closer look at RSSI measurements
RSSI is commonly used to assess Wi-Fi coverage across the network. However, the reported RSSI value can reflect different underlying measurements.
To illustrate this, using the same setup as that described in the previous articles, we look at the RSSI distributions of the beacon frames and data frames captured while downlink traffic was running between the AP and the Wi-Fi client. At the same capture location, the RSSI distributions for the two frame types differ as shown below:
![]()
Although this example focuses on beacon frames and data frames, RSSI can also be reported from different RF chains, different bandwidths or averaging windows. The exact RSSI delta can vary depending on the measurement method, but the main point is that both rows above are valid RSSI measurements even though the values differ by a few dB. If these are combined into a single summary, the aggregate can influence downstream interpretation. For example, it can make coverage appear better or worse than it would under a different measurement method. The summary can shift further if invalid RSSI samples are included in the aggregate rather than filtered out first.
3. Conclusion
Production systems generally rely on summaries, and it is appropriate to do so. In the RSSI example, it is useful to keep separate summaries for different frame types and to know which one is used downstream. Aggregation choices like these depend on how the metric is measured, so what is appropriate for RSSI will be different from that for channel utilization or PHY rate. Without guardrails and well-defined aggregation criteria, downstream applications can end up using misleading inputs.
If your team is working through similar telemetry or aggregation questions for your Wi-Fi system, feel free to reach out.